University of Connecticut Climate Resource Exchange

Showing posts with label NOAA. Show all posts

Wednesday, February 22, 2012

What Will Sea Level Rise Mean For Martha's Vineyard?


Fueled by warming global temperatures, sea level is rising throughout New England. Dukes County, Massachusetts, which is composed of the islands of Martha's Vineyard and Gosnold (South of Cape Cod and West of Nantucket in the map above), could be especially vulnerable to loss of land reclaimed by the sea. How much land is lost, exactly, and damage done will depend on the rate at which the rising occurs and actions taken by policymakers. By looking at data from a couple sources, however, it is possible to begin to understand what elevations of sea level rise could cause damage and which areas could be affected most severely.

First, here are the rates of sea level rise in two locations close to Dukes County- Nantucket and Woods Hole. These NOAA charts show observed trend in sea level during the 20th century:


Both of the charts above show that sea level is indeed rising in the area, but relatively slowly. The Nantucket graph shows a larger increase of 2.95 millimeters a year, but even with this number it would take over 300 years for the sea to rise a full meter. This may seem comforting, but there are still uncertainties within the climate system regarding sea level and recent research has indicated that sea level is rising faster than it has in two thousand years. With factors such as large amounts of ice loss in the polar regions and thermal expansion, this rate could increase. 

So, based on elevation data, let's take a look at what hypothetical increases in sea level would mean for The Vineyard and Gosnold:


While a rise of 1 meter would affect only 1% of the total land area of Dukes County, a rise of 5 meters would be disastrous and leave over 20% of the land in the county inundated. As we can see in the map below, there are large areas that would be vulnerable including much of the southern and eastern coasts of Martha's Vineyard.


An interesting and important conclusion from this analysis is the dramatic increase in effected land if sea level rise were to reach 3 meters. The graph below shows a crucial threshold; an increase of 2 meters will only cumulatively affect about 3% of the county, while the amount of new land affected when sea level rises from 2 to 3 meters is 9% (putting the would-be cumulative total at 12% of the total land in the county).


About this Post: This post includes some of the research I have done as a graduate student here at UConn in the Department of Geography. It was performed using ESRI's ArcMap, Microsoft Excel, and elevation data publicly available from MassGIS. I will be presenting this, in addition to other geographic analyses pertaining to storm surge vulnerability and social vulnerability, in a poster session at the 2012 AAG Annual Meeting in New York City this weekend.


Monday, October 31, 2011

Northeast Recieves Pre-Halloween Treat

An image of the storm from NOAA

The northeast was hit with an early snowstorm this past weekend, with the most snow falling in Jaffrey, NH (31 inches). If you are in Connecticut, and still without power, the CL&P map of power outages, which I wrote about in a post for Outside the Neatline, may be a useful resource. For a map of snow precipitation on October 30, 2011, see the map below from NOAA:


Thursday, September 15, 2011

La Niña and the Droughts


Towards the end of August, speculation began that La Niña was at work again causing extended droughts in both the Southwest US and East Africa. Last week, the verdict came in from NOAA: La Niña is back.

“'This means drought is likely to continue in the drought-stricken states of Texas, Oklahoma and New Mexico,' said Mike Halpert, deputy director of the (NOAA) Climate Prediction Center. 'La Niña also often brings colder winters to the Pacific Northwest and the northern Plains, and warmer temperatures to the southern states.'"


This Voice of America article explains the consequences in regard to East Africa.

"Wassila Thiaw studies Africa for the Climate Prediction Center at the National Weather Service in the United States. With a La Niña, Mr. Thiaw says the easterly winds that are supposed to bring moisture into East Africa are reduced." 
"Starting late last year, rains that were supposed to fall over Somalia, southern Ethiopia and northern Kenya failed. That part of the Horn of Africa has a second rainy season from March through May. Mr. Thiaw says that one failed, too, but for different reasons."

Consequently, it seems that the conditions in areas being affected by extended drought, like the Southwest US and East Africa, will not improve in the near future. 
La Niña is only one phase of a climate pattern known as El Niño Southern Oscillation (ENSO). The video below, from the NOAA Environmental Visualizations Labratory, shows 22 years of sea surface temperature. The ENSO pattern can be notably seen on the west coast of South America near Peru.


Friday, September 2, 2011

Tropical Storm Threatens Gulf Coast


A tropical depression has formed in the Gulf Coast. Tropical Depression Thirteen is projected to make landfall in Louisiana, as a Tropical Storm, late Sunday/early Monday morning.

Thursday, September 1, 2011

The Second Hurricane of 2011

Hurricane Katia, and its projected path, as of Thursday morning.

With many communities still coping with the destruction caused by Irene, a the second hurricane of the 2011 season has formed in the Atlantic. Hurricane Katia is chugging along, east of Puerto Rico, and is expected to strengthen to a major hurricane by Sunday morning.

Wednesday, August 31, 2011

NOAA Accurately Predicts Irene's Path

Although there are some examples of catastrophic damage caused by Irene, the National Oceanic and Atmospheric Administration was able to accurately predict the track of the storm, thus warning millions of people days in advance. The video below shows Irene's predicted track as well as the actual storm moving up the east coast


Hopefully this accuracy can be maintained in the future, as NOAA's budget to replace an aging generation of satellites has been slashed.


Wednesday, August 24, 2011

Today's Update on Hurricane Irene


As seen in this image from NOAA, Hurricane Irene's eye has formed Southeast of Florida.

Today's latest NOAA projections of Hurricane Irene's path have the storm reaching us, here in New England, sometime in the latter half of Sunday.


When it does reach us, it is projected to still be a Category 2 hurricane which, Andrew Revkin of the NYT warns, could mean hazardous flash flooding.


If and when Irene makes landfall, it will be the first Hurricane to hit the US mainland since Hurricane Ike in 2008.


In Case You Missed It...

Last week, NPR ran a special series entitled Race to the Arctic, which explores the geopolitical consequences (like new shipping routes and access to new reserves of natural resources) of the permanent loss of sea ice in the Arctic due to the warming climate. Nations like Canada, Greenland, Russia and the United States all stand to either gain or lose politically and economically moving forward this century. Below is a quick video from the NOAA Environmental Visualization Laboratory displaying the 2010 Arctic Minimum Sea Ice Extent:


Tuesday, August 23, 2011

Update: Hurricane Irene Approaches US Coast

A time-lapse of Hurricane Irene from the GOES-east satellite (see more from NOAA Visualizations)

On the same day a 5.9 magnitude earthquake shook the eastern seaboard, Hurricane Irene is gaining strength. It is expected to hit the US mainland this weekend.

Irene's projected path as of Tuesday 5 PM.

Irene was expected to reach Category 3 sometime today, and some forecasts have Irene as reaching Category 4 before making landfall. We, here in Connecticut, are projected to feel the effects sometime on Sunday.


Thursday, August 18, 2011

Drought in the Horn of Africa

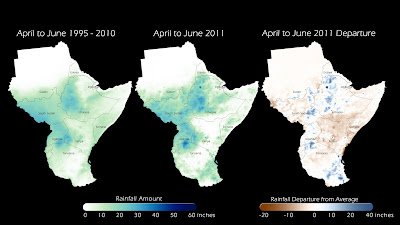
Below average rainfall in the Horn of Africa has created a humanitarian crises.

The Horn of Africa has experienced extended drought for the past decade. This year in particular, disappointing wet seasons in addition to the expected dry season have created a humanitarian crises. This NOAA page explains that the region is dependent on two rainy seasons: one in the fall and one and the spring. This past year has been especially dry, which creates a critical situation when considering the sub-Saharan summer. USAID has created a map that shows the most critically affected areas in terms of food security. This article from Plan details some of the hardships being endured by families in Kenya while this article in The Guardian discusses how the population of Djibouti is being affected. According to the latter article, up to 80% of livestock has been lost while food prices have risen 50% in Djibouti. USAID has taken action in the form of emergency assistance in the region. Although the people of the Horn of Africa are in dire need for aid now, this blog post from AlertNet makes the case for the importance of proactive measures. Risk reduction efforts ahead of time, Esther Williams writes, is incredibly cost efficient. With the projected influence of climate change, initiating adaptation in anticipation of future crises seems to be a better investment than waiting to react. This drought alone may kill up to 400,000 children due to starvation.


Tuesday, August 16, 2011

Map of Selected Climate Anomalies (July 2011)


More from NOAA about last month; this map displays selected climate anomalies and events that occurred around the world (July 2011). Some events to note are the heatwave in the US, above average temperatures in Australia, and drought in Eastern Africa.


Monday, August 15, 2011

More On July's Extreme Heat

Much of the country experienced higher than average temperatures in July.

To follow up last week's post about July's extreme heat, here is another NOAA article about the heatwave that much of the country experienced.

  • "41 of the lower 48 states had above-normal, much-above-normal, or a record warmest July."
  • "The South climate region -- Arkansas, Kansas, Louisiana, Mississippi, Oklahoma, and Texas -- had its warmest single calendar month for any climate region on record."
  • "Exceptional drought, as defined by the U.S. Drought Monitor, covers more than 75 percent of Texas (201,436 sq mi)."
Record high (day and night) temperatures across the US.

Thursday, August 11, 2011

More on ENSO

In this press release from the University of HawaiʻiAxel Timmermann of the University of Hawaiʻi at Mānoa and colleagues discuss their new article in Science about the impact of El Niño on East Africa. Check out this previous post to see a NOAA animation of ENSO in action!

July's Extreme Heat

Vegetation anomalies in North America (July 2011)
Throughout July 2011, the United States experienced extraordinarily high temperatures and many states in the Southwest felt the effects of drought conditions. The impact of this drought on vegetation growth can be seen in the photo above. The image, from the NASA Earth Observatory, displays vegetation anomalies across North America in July. To learn about the national weather pattern that caused such extreme conditions, visit this NOAA page. The progression of the heatwave can be seen in these two NOAA Environmental Visualization Laboratory animations that show how conditions changed throughout the second half of the month:


Wednesday, August 3, 2011

The Rising Sea

In honor of Discovery Channel's Shark Week, the CRE Blog is featuring ocean-related content  this week.


Loss of land-based ice, like on Antarctica, is one of the driving factors behind sea level rise

Climate is the driver of sea level change. The Earth has alternated between Glacial and Interglacial Periods for millions of years. During a Glacial Period, or Ice Age, much of the water on Earth is trapped in ice sheets and, consequently, sea level drops. Interglacial Periods, on the other hand, are times of warmer temperatures which cause ice sheets to melt. When the ice becomes liquid water, it eventually finds its way to the oceans and raises the sea level. In addition, because the oceans are warmer during interglacial periods, the water expands (known as thermal expansion), which also adds to the sea level rising.

This animation from NOAA shows evidence of loss of ice in the North Pole.

Sea level has steadily risen 1-2.5 millimeters a year since 1900, and it is expected to continue to rise throughout the 21st century. Although there is no perfect model to absolutely predict the future, it is possible to investigate "What If?"

Models based on elevation data can predict what areas could be vulnerable due to rising sea levels.

The Department of Geosciences Environmental Studies Laboratory at the University of Arizona has a web tool that does just that. They have developed a Geographic Information System (GIS) that uses Digital Elevation Models (DEM) to show what areas are potentially vulnerable to sea level change. This web visualization, developed with ESRI's ArcViewer for Flex, allows users to set the amount of sea level rise in one meter increments with a range from no change to six meters.

Monday, August 1, 2011

Shark Week Ocean Reading

In honor of Discovery Channel's Shark Week,  the CRE Blog is featuring ocean-related content this week.


Author Susan Casey is Editor-In-Chief of O, The Oprah Magazine

The Wave by Susan Casey - The Wave examines the largest and most extreme waves of our oceans. Throughout the book, Casey documents two groups who chase these waves around the world; the scientists who wish to learn the secrets of our planet and those surfers who wish to push themselves to the limit physically and spiritually by riding freakishly large waves. This book features discussion of climate in terms of whether or not a consequence of global warming will be more stormy oceans, and thus, larger waves. Click here to read a review from the New York Times.


Casey is also the author of The Devil's Teeth, which focuses on Northern California's Great White Sharks. Click here for the New York Times review


Author Dr. Bruce Parker, currently of the Center for Maritime Systems at the Stevens Institute of Technology, is the former Chief Scientist of the National Ocean Service.


While Casey's writing features a journalistic tone, The Power of the Sea by Bruce Parker- former Chief Scientist of the National Ocean Service in NOAA- features a voice that is more scientific in nature. Parker discusses particular extreme events like the 2004 tsunami in the Indian Ocean and successfully conveys the history of the human mission to predict ocean related phenomena (for example, tides, tsunamis and storm surges). In addition, he details our contemporary technology that is in use and working toward this end of improving our ability to predict the Sea. The last chapter, entitled Predicting the Future-and Saving Lives is a forward looking discussion driven by the topics of El Niño and long term climate change.

Thursday, July 28, 2011

NOAA Animation Shows ENSO Transition in Pacific


A recent time-lapse (March 1, 2011 to June 7, 2011) animation created at NOAA's Environmental Visualization Laboratory shows a transition in the Pacific from La Niña to a neutral period. This warming and cooling cycle happens every few years and is called the El Niño Southern Oscillation or ENSO. While El Niño is marked by warmer than normal temperatures, La Niña is marked by cooler temperatures. For more information on what ENSO, visit this NOAA website!