The northeast was hit with an early snowstorm this past weekend, with the most snow falling in Jaffrey, NH (31 inches). If you are in Connecticut, and still without power, the CL&P map of power outages, which I wrote about in a post for Outside the Neatline, may be a useful resource. For a map of snow precipitation on October 30, 2011, see the map below from NOAA:
“'This means drought is likely to continue in the drought-stricken states of Texas, Oklahoma and New Mexico,' said Mike Halpert, deputy director of the (NOAA) Climate Prediction Center. 'La Niña also often brings colder winters to the Pacific Northwest and the northern Plains, and warmer temperatures to the southern states.'"
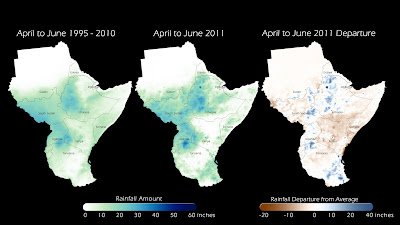
"Wassila Thiaw studies Africa for the Climate Prediction Center at the National Weather Service in the United States. With a La Niña, Mr. Thiaw says the easterly winds that are supposed to bring moisture into East Africa are reduced." "Starting late last year, rains that were supposed to fall over Somalia, southern Ethiopia and northern Kenya failed. That part of the Horn of Africa has a second rainy season from March through May. Mr. Thiaw says that one failed, too, but for different reasons."
Consequently, it seems that the conditions in areas being affected by extended drought, like the Southwest US and East Africa, will not improve in the near future.
Although there are some examples of catastrophic damage caused by Irene, the National Oceanic and Atmospheric Administration was able to accurately predict the track of the storm, thus warning millions of people days in advance. The video below shows Irene's predicted track as well as the actual storm moving up the east coast
Last week, NPR ran a special series entitled Race to the Arctic, which explores the geopolitical consequences (like new shipping routes and access to new reserves of natural resources) of the permanent loss of sea ice in the Arctic due to the warming climate. Nations like Canada, Greenland, Russia and the United States all stand to either gain or lose politically and economically moving forward this century. Below is a quick video from the NOAA Environmental Visualization Laboratory displaying the 2010 Arctic Minimum Sea Ice Extent:
Throughout July 2011, the United States experienced extraordinarily high temperatures and many states in the Southwest felt the effects of drought conditions. The impact of this drought on vegetation growth can be seen in the photo above. The image, from the NASA Earth Observatory, displays vegetation anomalies across North America in July. To learn about the national weather pattern that caused such extreme conditions, visit this NOAA page. The progression of the heatwave can be seen in these two NOAA Environmental Visualization Laboratory animations that show how conditions changed throughout the second half of the month: