University of Connecticut Climate Resource Exchange

Showing posts with label greenhouse gases. Show all posts

Wednesday, February 8, 2012

UCAR & NCAR: Steroids, Baseball, and Climate Change


Earth's Climate on SteroidsUCAR & NCAR have published a video that explains human induced climate change using the analogy of steroids in baseball, which can be seen above or on YouTube (for more, see: Doping the Atmosphere?). With the increased concentrations of greenhouse gases in the atmosphere, we are more likely to experience temperature anomalies that are warmer than previous norms. Similarly, when baseball players have used steroids, many have seen drastic increases in statistical categories. Warmer than expected temperatures for the month of June (2011) can be seen in the National Climatic Data Center map below.
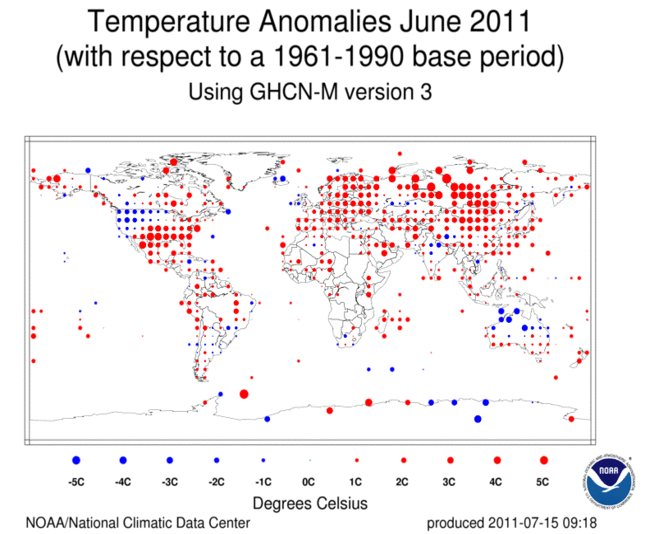
A global map of temperature anomalies in June 2011 with respect to 1961-1990 from the NCDC .


Friday, December 9, 2011

ESRI Map of Carbon Dioxide Emissions


ESRI has produced a map that displays carbon dioxide emissions from 1960 to 2008. The map is dynamic in that it allows the user to pick the year, or consecutive years, to display in addition to having the ability to "play" the map as an animated timeline. Another cool feature of the map is that it has two sets of symbology; the map displays countries' total emissions as a color and relative emissions are represented by dots. For more information, including how the map was made, visit ESRI's Map Story Profile.