
TEDx events are independently organized TED events that follow the general TED format, but are organized locally. I came across Dr. Michael Mann's presentation at TEDxPSU on twitter (follow him: @MichaelEMann). Dr. Mann is known for his extensive research in paleoclimatology- including the Hockey Stick Graph that displays recent, rapid global warming.

Wednesday, December 14, 2011
TEDxPSU: Dr. Michael Mann - A Look Into Our Climate: Past To Present To Future
TEDx events are independently organized TED events that follow the general TED format, but are organized locally. I came across Dr. Michael Mann's presentation at TEDxPSU on twitter (follow him: @MichaelEMann). Dr. Mann is known for his extensive research in paleoclimatology- including the Hockey Stick Graph that displays recent, rapid global warming.
Friday, December 9, 2011
ESRI Map of Carbon Dioxide Emissions

ESRI has produced a map that displays carbon dioxide emissions from 1960 to 2008. The map is dynamic in that it allows the user to pick the year, or consecutive years, to display in addition to having the ability to "play" the map as an animated timeline. Another cool feature of the map is that it has two sets of symbology; the map displays countries' total emissions as a color and relative emissions are represented by dots. For more information, including how the map was made, visit ESRI's Map Story Profile.
Friday, November 18, 2011
What Will Climate Change Mean for Australia?
Jeff Goodell, of Rolling Stone, visited Australia to find out:
"I have come to Australia to see what a global-warming future holds for this most vulnerable of nations, and Mother Nature has been happy to oblige: Over the course of just a few weeks, the continent has been hit by a record heat wave, a crippling drought, bush fires, floods that swamped an area the size of France and Germany combined, even a plague of locusts."
Read the full article here.
Thursday, November 17, 2011
Mapping Climate Change Vulnerability
As this month's conference United Nations Climate Change conference in Durban nears, here is a map, which I first read about on this blog, of climate vulnerability as concluded in a study by Maplecroft:

As shown in the image above, the top ten most vulnerable countries are:
The study combines socioeconomic factors, including such items as poverty and rate of population growth, with physical factors, such as the likelihood of natural hazards occurring.

As shown in the image above, the top ten most vulnerable countries are:
- Haiti
- Bangladesh
- Zimbabwe
- Sierra Leone
- Madagascar
- Cambodia
- Mozambique
- Democratic Republic of the Congo
- Malawi
- Philippines
The study combines socioeconomic factors, including such items as poverty and rate of population growth, with physical factors, such as the likelihood of natural hazards occurring.
Wednesday, November 16, 2011
Visualizing the Anthropocene
Humans' impact on the Earth has been so profound that many scientists are now referring to a new geologic epoch, the Anthropocene. Arguments for this new era are found in such changes as climatic forcing through greenhouse gas emissions as well as upsetting the nitrogen cycle due to an ever increasing population. A dynamic resource for being able to see what this actually looks like is A Cartography of the Anthropocene. The website, created by Globaïa, features a variety of maps demonstrating the human effect at the global scale. My favorite, pictured below, is a map of the global transportation system.
 |
| The Global Transportation System. Globaïa "is a global education organization whose mission is to foster a consistent and informed participation of citizens in environmental issues by understanding the multiple dimensions of today's world and its likely future." |
Tuesday, November 15, 2011
In Case You Missed It...New Tools for Evaluating Greenhouse Gas Emissions
Back in October, two new protocols for evaluating greenhouse gases debuted. The Product Life Cycle and Corporate Value Chain GHG protocol standards are designed to give companies a competitive advantage by saving money and reducing risks. Watch for more:
Tuesday, November 1, 2011
Are Climate Scientists Too Conservative?
Dr. Naomi Oreskes discusses her research that investigates if scientists' naturally conservative attitudes have led to bias in climate research (in that the impacts of climate change have been understated).
Monday, October 31, 2011
Northeast Recieves Pre-Halloween Treat
 |
| An image of the storm from NOAA |
The northeast was hit with an early snowstorm this past weekend, with the most snow falling in Jaffrey, NH (31 inches). If you are in Connecticut, and still without power, the CL&P map of power outages, which I wrote about in a post for Outside the Neatline, may be a useful resource. For a map of snow precipitation on October 30, 2011, see the map below from NOAA:

Monday, October 24, 2011
Interactive Map Displays Extreme Weather Events
 |
| This map, from the Pew Center on Global Climate Change, shows extreme weather events since 1995. |
For information regarding recent extremes weather events check out this map from the Pew Climate on Global Climate Change, which displays events that occurred between 1995 and the present. The map features recent events that happened this past summer such as flooding in the Northeast and droughts in Texas in addition to older events like Chicago's heatwave in 1995.
Tuesday, October 18, 2011
CAMEL - Climate, Adaptation, Mitigation, E-Learning


Wednesday, October 5, 2011
Interactive Map Showcases Climatic, Environmental, and Social Research

The Climate Change Adaptation Knowledge and Mitigation Network (AKMN) is "a platform for accessing and sharing current agricultural adaptation and mitigation knowledge". The AKMN website features an ESRI powered map that showcases interdisciplinary research on agricultural and food systems research related to climate change adaptation. In addition to the future implications, the importance of this research can be seen in the present, especially given the current events in Africa. Visit the links above for more!
Friday, September 23, 2011
EPA Regional Administrator Curt Spalding Discusses Sustainability at UConn
Curt Spalding, Regional Administrator for the EPA in the New England region, gave a guest lecture today in the UConn School of Engineering. During his talk, entitled A Sustainable Future, Mr. Spalding touched upon a variety of projects that the EPA is currently working on including zero-emission water treatment facilities and green chemistry. The portion that I found most interesting, however, was a discussion of a Boston-based project that saw the EPA, HUD and DOT work together with local government to create transit oriented developments for communities that have been under served by commuter rail. This holistic approach breaks the "silo" mentality for government planning and could be a good sign of future things to come. For more check out the video below!
Tuesday, September 20, 2011
What Countries are Prepared for Climate Change?

The Global Adaptation Institute's Global Adaptation Index (GaIn) "summarizes a country's Vulnerability to climate change and other global challenges on the one hand and its Readiness to improve resilience on the other hand". How prepared is your country for climate change? According to the Global Adaptation Institute, if your country is one that is going to be profoundly affected by a changing climate, then odds are it is not prepared. According to this matrix, the countries who are most vulnerable are the least ready to adapt.

European countries are concentrated at the top of the rankings of the GaIn index in addition to Australia (#4), New Zealand (#5) and the United States (#8). The Global Adaptation Institute used a variety of literature to create this index. For more follow this link!
Climate Week NYC 2011 Underway

Climate NYC 2011, a week long conference on climate change that includes NGO's, business and government leaders, began yesterday. The goal of this conference is to focus on driving a 'clean industrial revolution'. Many of the events are open to the public, so if you are in the area check them out!
Thursday, September 15, 2011
24 Hours of Reality Underway

On Tuesday, former Vice President Al Gore appeared on the Colbert Report to promote the Climate Reality Project's 24 Hours of Reality. In an attempt to raise climate awareness, during this 24 hour period (yesterday to today), the Climate Reality Project will be showcasing speakers in each time zone around the world at 7 pm (in each respective timezone). Click here to view the map of presenters! At 7 pm in our timezone, here in Connecticut, Vice President Gore will be presenting from New York City.
La Niña and the Droughts

Towards the end of August, speculation began that La Niña was at work again causing extended droughts in both the Southwest US and East Africa. Last week, the verdict came in from NOAA: La Niña is back.
“'This means drought is likely to continue in the drought-stricken states of Texas, Oklahoma and New Mexico,' said Mike Halpert, deputy director of the (NOAA) Climate Prediction Center. 'La Niña also often brings colder winters to the Pacific Northwest and the northern Plains, and warmer temperatures to the southern states.'"
This Voice of America article explains the consequences in regard to East Africa.
"Wassila Thiaw studies Africa for the Climate Prediction Center at the National Weather Service in the United States. With a La Niña, Mr. Thiaw says the easterly winds that are supposed to bring moisture into East Africa are reduced."
"Starting late last year, rains that were supposed to fall over Somalia, southern Ethiopia and northern Kenya failed. That part of the Horn of Africa has a second rainy season from March through May. Mr. Thiaw says that one failed, too, but for different reasons."
Consequently, it seems that the conditions in areas being affected by extended drought, like the Southwest US and East Africa, will not improve in the near future.
La Niña is only one phase of a climate pattern known as El Niño Southern Oscillation (ENSO). The video below, from the NOAA Environmental Visualizations Labratory, shows 22 years of sea surface temperature. The ENSO pattern can be notably seen on the west coast of South America near Peru.
Thursday, September 8, 2011
Google Releases Carbon Footprint

Internet giant Google has disclosed its carbon footprint. Google's total emissions in 2010 were just under 1.5 million tons of carbon dioxide. As a reference point, this is higher than the entire country of Laos and is similar to the United Nation's operational carbon footprint. On a brighter note, Google asserts that their data centers use half the energy as their industrial counterparts. In addition, cloud computing, which is what Gmail uses, greatly improves energy efficiency (when compared to services that must have dedicated servers). Other interesting numbers are: each Google search accounts for about 0.2g of carbon dioxide emitted while ten minutes of YouTube viewing equates to 1g of carbon dioxide emitted. For more information, visit Google Green.
Wednesday, September 7, 2011
Hellish Conditions Persist

 |
| Astronaut Ron Garan tweeted this picture of the Texas wildfires from the International Space Station. |
Since December, wildfires have consumed an area of land that is approximately the size of Connecticut; the lack of containment of the blazes is being called unprecedented. And, while large amounts of rain is being dumped further east, Texas is not receiving the water it so desperately needs (see below).
 |
| Most of Texas needs over a foot of rain to end drought conditions. |
In 2011, about 6 million acres have been burned nationally; over 3 million have been in Texas. And, unfortunately, there is no end in sight to these conditions.
 |
| Drought conditions are expected to persist in the southwest US throughout the Fall. |

Friday, September 2, 2011
Tropical Storm Threatens Gulf Coast

A tropical depression has formed in the Gulf Coast. Tropical Depression Thirteen is projected to make landfall in Louisiana, as a Tropical Storm, late Sunday/early Monday morning.
Irene's Precipitation Distribution

Irene's rainfall resulted in devastating flooding for communities in multiple states in the northeast (and much of the rest of the east coast). The flooding experienced not only destroyed properties but took lives. See the distribution of precipitation in the image above from the National Weather Service.
Thursday, September 1, 2011
The Second Hurricane of 2011
 |
| Hurricane Katia, and its projected path, as of Thursday morning. |
With many communities still coping with the destruction caused by Irene, a the second hurricane of the 2011 season has formed in the Atlantic. Hurricane Katia is chugging along, east of Puerto Rico, and is expected to strengthen to a major hurricane by Sunday morning.
Wednesday, August 31, 2011
NOAA Accurately Predicts Irene's Path
Although there are some examples of catastrophic damage caused by Irene, the National Oceanic and Atmospheric Administration was able to accurately predict the track of the storm, thus warning millions of people days in advance. The video below shows Irene's predicted track as well as the actual storm moving up the east coast
Hopefully this accuracy can be maintained in the future, as NOAA's budget to replace an aging generation of satellites has been slashed.
Hopefully this accuracy can be maintained in the future, as NOAA's budget to replace an aging generation of satellites has been slashed.
Tuesday, August 30, 2011
ArcGIS Tutorial: Creating a Simple Hurricane and Population Map
Last week, I posted a quick map I generated of Irene's path and the population density of the Northeast. I have posted a tutorial on where to find applicable data and how to create something similar in a post on Outside the Neatline.
Aftermath of Irene, Next up: Tropical Storm Katia
Hurricane/Tropical Storm Irene came through the east coast this weekend, killing at least 38 and leaving an estimated 3.3 million people without electricity. Connecticut's eastern half of the state has been especially affected by power outages, which can be seen on Connecticut Light & Power's map of power outages. For information on the federal government's response to Irene, check out this National Oceanic Service website. Next up? Tropical Storm Katia is projected to strengthen to a major hurricane Sunday morning in the Caribbean.
Thursday, August 25, 2011
Irene Heading For Densely Populated Northeast
 |
| As of Thursday morning, Hurricane Irene was heading towards the Northeast's population centers. |
Wednesday, August 24, 2011
Today's Update on Hurricane Irene
 |
| As seen in this image from NOAA, Hurricane Irene's eye has formed Southeast of Florida. |
Today's latest NOAA projections of Hurricane Irene's path have the storm reaching us, here in New England, sometime in the latter half of Sunday.

When it does reach us, it is projected to still be a Category 2 hurricane which, Andrew Revkin of the NYT warns, could mean hazardous flash flooding.

How Ice Sheets Influence Tectonic Activity
In a piece from CNN.com, Cornell University Professor Rowena Lohman discusses some of the dynamics behind yesterdays 5.8 magnitude earthquake centered in Virginia. With respect to climate, Dr. Lohman cites "...the melting of large ice sheets and glaciers that used to cover North America during the last ice age 14,000 years ago. When the ice sheet was on top of the North America, it pressed down on the Earth's crust, causing it to sink lower. Since the ice melted and the weight was removed, the crust has been slowly rebounding back to its normal position, and that motion causes earthquakes."
This phenomenon is known as Post Glacial ( or Isostatic) Rebound and is also discussed in this National Geographic piece from 2008.
This phenomenon is known as Post Glacial ( or Isostatic) Rebound and is also discussed in this National Geographic piece from 2008.
In Case You Missed It...
Last week, NPR ran a special series entitled Race to the Arctic, which explores the geopolitical consequences (like new shipping routes and access to new reserves of natural resources) of the permanent loss of sea ice in the Arctic due to the warming climate. Nations like Canada, Greenland, Russia and the United States all stand to either gain or lose politically and economically moving forward this century. Below is a quick video from the NOAA Environmental Visualization Laboratory displaying the 2010 Arctic Minimum Sea Ice Extent:
Tuesday, August 23, 2011
Update: Hurricane Irene Approaches US Coast
A time-lapse of Hurricane Irene from the GOES-east satellite (see more from NOAA Visualizations)
On the same day a 5.9 magnitude earthquake shook the eastern seaboard, Hurricane Irene is gaining strength. It is expected to hit the US mainland this weekend.
 |
| Irene's projected path as of Tuesday 5 PM. |
Irene was expected to reach Category 3 sometime today, and some forecasts have Irene as reaching Category 4 before making landfall. We, here in Connecticut, are projected to feel the effects sometime on Sunday.
Monday, August 22, 2011
Hurricane Irene Nearing Southeast US

According to NOAA's projected path (see above), Hurricane Irene may make landfall in the Southeast US later this week. Visit this NOAA website to keep up to date.
Thursday, August 18, 2011
Drought in the Horn of Africa
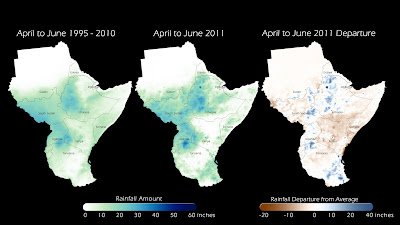 |
| Below average rainfall in the Horn of Africa has created a humanitarian crises. |
The Horn of Africa has experienced extended drought for the past decade. This year in particular, disappointing wet seasons in addition to the expected dry season have created a humanitarian crises. This NOAA page explains that the region is dependent on two rainy seasons: one in the fall and one and the spring. This past year has been especially dry, which creates a critical situation when considering the sub-Saharan summer. USAID has created a map that shows the most critically affected areas in terms of food security. This article from Plan details some of the hardships being endured by families in Kenya while this article in The Guardian discusses how the population of Djibouti is being affected. According to the latter article, up to 80% of livestock has been lost while food prices have risen 50% in Djibouti. USAID has taken action in the form of emergency assistance in the region. Although the people of the Horn of Africa are in dire need for aid now, this blog post from AlertNet makes the case for the importance of proactive measures. Risk reduction efforts ahead of time, Esther Williams writes, is incredibly cost efficient. With the projected influence of climate change, initiating adaptation in anticipation of future crises seems to be a better investment than waiting to react. This drought alone may kill up to 400,000 children due to starvation.
Wednesday, August 17, 2011
Cities Are Sources of Concerns and Solutions for Climate Change Adaptation
 |
| The September (2011) Scientific American features a special issue on cities. |
Today, CNN's website prominently displayed this opinion piece by Reiner de Graaf, Partner at the Office for Metropolitan Architecture. De Graaf reminds the reader of how unequal development affects sustainable development and adaptation to climate change. For example, he cites that three of fastest growing urban regions in the world, Kabul, Dhaka and Nairobi, have been impacted by environmental hazards. In addition, of the 27 cities predicted to have over 10 million inhabitants by 2020, 21 will be located in the developing world. De Graaf concludes that "...it could well take an ecological equivalent to the U.N. Security Council... to create the realpolitik that climate change will inevitably have to become subject to."
This may paint a bleak picture, however there are many working to improve the urban environment. This interactive image from Scientific American shows some of the environmental solutions being implemented in cities around the (developed) world. Scientific American is devoting its September issue to improving the cityscape- check it out! For more on finding a road to sustainable cities, read this recent blog post from Charles Wolfe in the Huffington Post.
The Rimba Raya Project and the Market for Carbon
Adapting our behavior to climate change can be a long and difficult process. The more stakeholders involved, the more complicated and bureaucratic and it can become. Take this article, for instance, which details a forest preservation project in Indonesia that has been both delayed and reduced while it has progressed. The Rimba Raya Project, on the island of Borneo, was to preserve 225,000 acres of tropical rain forest that is valued at about $500 million in carbon credits. Todd Lemons, who has worked on the project with Russian company Gazprom, discusses his frustration in the article: "Success was literally two months around the corner...We went through -- if there are 12 steps, we went through the first 11 on time over a 2-year period. We had some glitches, but by and large we went through the rather lengthy and complicated process in the time expected."
Watch the video below for more information about the Rimba Raya Project and carbon trading:
Watch the video below for more information about the Rimba Raya Project and carbon trading:
Dan Barry, of Gazprom, discusses his company's work in the carbon credit market.
La Niña Cause of US Drought?

This article, from NewScientist, discusses two possible causes for the extended heatwave in the US: La Niña or the jet stream being stuck in one place.
Tuesday, August 16, 2011
Warming Ocean Leading to Less California Coast Fog
A recent article in the Santa Cruz Sentinel discusses the declining fog on the California coast. Throughout the second half of the 20th Century, scientist have found that the fog, which is so critical for the region's vegetation, has been affected by warming ocean temperatures. Researchers are quoted in the article as saying:
- "Redwood forests and other plants are so dependent on fog and fog is declining; this spells an uncertain future for redwood trees and redwood forest ecosystems."
- "The Central coast has such rich diversity of local endemic plants -- more so than anywhere in California. A decrease in fog could shift the vegetation in general and we could lose these species."
- "Fog formation is very much dependent on warm air interacting with the cold ocean. If you warm up the ocean surface, the contrast between the atmosphere and sea surface temperature goes down."
To see the beautiful landscape which the fog enables, check out this cool time lapse of the fog around the Santa Ynez Mountains near Santa Barbara, CA!
Map of Selected Climate Anomalies (July 2011)

More from NOAA about last month; this map displays selected climate anomalies and events that occurred around the world (July 2011). Some events to note are the heatwave in the US, above average temperatures in Australia, and drought in Eastern Africa.
Monday, August 15, 2011
More On July's Extreme Heat
 |
| Much of the country experienced higher than average temperatures in July. |
To follow up last week's post about July's extreme heat, here is another NOAA article about the heatwave that much of the country experienced.
- "41 of the lower 48 states had above-normal, much-above-normal, or a record warmest July."
- "The South climate region -- Arkansas, Kansas, Louisiana, Mississippi, Oklahoma, and Texas -- had its warmest single calendar month for any climate region on record."
- "Exceptional drought, as defined by the U.S. Drought Monitor, covers more than 75 percent of Texas (201,436 sq mi)."
 |
| Record high (day and night) temperatures across the US. |
Friday, August 12, 2011
Climate Change Leading to Ecological Changes in the Polar Regions
Michael Gooseff, Associate Professor of Civil & Environmental Engineering at Penn State, discusses his research in this article from Penn State Live. His work focuses on how the Polar Regions of Earth are being influenced by climate change. For more on the Arctic Sea, watch this NOAA animation.
Thursday, August 11, 2011
More on ENSO
In this press release from the University of Hawaiʻi, Axel Timmermann of the University of Hawaiʻi at Mānoa and colleagues discuss their new article in Science about the impact of El Niño on East Africa. Check out this previous post to see a NOAA animation of ENSO in action!
Consumption Based Accounting of Carbon Emissions
Carnegie Institution of Science Department of Global Ecology (Stanford) staff scientist Ken Caldeira discusses how patterns of consumption influence carbon emissions. Click here for more.
July's Extreme Heat
 |
| Vegetation anomalies in North America (July 2011) |
Tuesday, August 9, 2011
Sea Level Rise in New England
Last week, I wrote a post discussing climate change and rising sea level, which focuses on the global scale. Back in April, Climatide published a post that discusses four reasons for sea level rise in New England. The author, Heather Goldstone, lists these four phenomena as influences on New England's "above average" sea level rise:
- Rising Ocean Temperatures
- Melting Ice
- Changing Circulation
- Shifting Land
Monday, August 8, 2011
Interactive Map Shows Climate Change Policies in Connecticut Towns
 |
| An interactive map displaying policies related to Climate Change was published by the State of Connecticut. |
Interested in investigating whether or not your town (in CT) has adopted policies related to Climate Change? Explore this interactive map published on the State of Connecticut's Official Climate Change website.
Friday, August 5, 2011
GIS Used to Monitor Disease in Coral
In honor of Discovery Channel's Shark Week, the CRE Blog is featuring ocean-related content this week.
In a blog post earlier this week, I highlighted the relationship between coral bleaching and climate. Yesterday, the American Association of Geographers' Smartbrief featured this article in Environmental Protection discussing researchers at the University of Florida using Geographic Information Systems (GIS) to monitor the health of coral reefs. Caribbean coral reefs have recently been ravaged by disease, and researchers are trying to find the cause; with some theories being climate related. For more on their results, read their article in PLoS One. For more GIS related content, check out Outside the Neatline and for more coral-related GIS content, visit ReefBase.
 |
| ReefBase is a "Global Information System for Coral Reefs" |
In a blog post earlier this week, I highlighted the relationship between coral bleaching and climate. Yesterday, the American Association of Geographers' Smartbrief featured this article in Environmental Protection discussing researchers at the University of Florida using Geographic Information Systems (GIS) to monitor the health of coral reefs. Caribbean coral reefs have recently been ravaged by disease, and researchers are trying to find the cause; with some theories being climate related. For more on their results, read their article in PLoS One. For more GIS related content, check out Outside the Neatline and for more coral-related GIS content, visit ReefBase.
Thursday, August 4, 2011
The Conveyor Belt
In honor of Discovery Channel's Shark Week, the CRE Blog is featuring ocean-related content this week.
The Gulf Stream is a warm ocean current that influences the climate on both sides of the Atlantic Ocean. By transporting warm water from Florida, up the United States' eastern seaboard, and across the Atlantic to Europe, this current creates warmer climates than otherwise would be possible from Bermuda to Northern Europe. Click here for maps of current sea surface temperatures in the Gulf Stream.
The Gulf Stream is one part a Global Conveyor Belt, known as Thermohaline Circulation, in the oceans that moves warm and cold water throughout the Earth's oceans. It is driven by density. Cold, dense water in the polar regions sinks, flows toward the equator, and rises back toward the surface. Warm water originating in the equatorial regions, on the other hand, is less dense and flows across the surface of the oceans toward the polar regions. These currents have a vital impact on the entire global climate. Click the animation above to see it in action!
 |
| This image, from NASA, shows temperature values in the Gulf Stream. |
The Great Ocean Conveyor Belt
Wednesday, August 3, 2011
The Rising Sea
In honor of Discovery Channel's Shark Week, the CRE Blog is featuring ocean-related content this week.
Climate is the driver of sea level change. The Earth has alternated between Glacial and Interglacial Periods for millions of years. During a Glacial Period, or Ice Age, much of the water on Earth is trapped in ice sheets and, consequently, sea level drops. Interglacial Periods, on the other hand, are times of warmer temperatures which cause ice sheets to melt. When the ice becomes liquid water, it eventually finds its way to the oceans and raises the sea level. In addition, because the oceans are warmer during interglacial periods, the water expands (known as thermal expansion), which also adds to the sea level rising.
Sea level has steadily risen 1-2.5 millimeters a year since 1900, and it is expected to continue to rise throughout the 21st century. Although there is no perfect model to absolutely predict the future, it is possible to investigate "What If?"
The Department of Geosciences Environmental Studies Laboratory at the University of Arizona has a web tool that does just that. They have developed a Geographic Information System (GIS) that uses Digital Elevation Models (DEM) to show what areas are potentially vulnerable to sea level change. This web visualization, developed with ESRI's ArcViewer for Flex, allows users to set the amount of sea level rise in one meter increments with a range from no change to six meters.
Loss of land-based ice, like on Antarctica, is one of the driving factors behind sea level rise
Climate is the driver of sea level change. The Earth has alternated between Glacial and Interglacial Periods for millions of years. During a Glacial Period, or Ice Age, much of the water on Earth is trapped in ice sheets and, consequently, sea level drops. Interglacial Periods, on the other hand, are times of warmer temperatures which cause ice sheets to melt. When the ice becomes liquid water, it eventually finds its way to the oceans and raises the sea level. In addition, because the oceans are warmer during interglacial periods, the water expands (known as thermal expansion), which also adds to the sea level rising.
 |
| This animation from NOAA shows evidence of loss of ice in the North Pole. |
Sea level has steadily risen 1-2.5 millimeters a year since 1900, and it is expected to continue to rise throughout the 21st century. Although there is no perfect model to absolutely predict the future, it is possible to investigate "What If?"
 |
| Models based on elevation data can predict what areas could be vulnerable due to rising sea levels. |
The Department of Geosciences Environmental Studies Laboratory at the University of Arizona has a web tool that does just that. They have developed a Geographic Information System (GIS) that uses Digital Elevation Models (DEM) to show what areas are potentially vulnerable to sea level change. This web visualization, developed with ESRI's ArcViewer for Flex, allows users to set the amount of sea level rise in one meter increments with a range from no change to six meters.
Tuesday, August 2, 2011
Climate Change and Coral Reefs
In honor of Discovery Channel's Shark Week, the CRE Blog is featuring ocean-related content this week.
Coral Reefs are some of the most colorfully vibrant and biodiverse habitats on Earth, but they are also extremely vulnerable to adverse effects of fluctuations in sea conditions. When sea temperature rises, corals become stressed and coral bleaching often begins. Coral bleaching, which results in the coral turning white, is a breakdown in the symbiotic relationship between the organisms that comprise coral. Although this does not necessarily mean the coral has died, it is left extremely vulnerable to further damage and death.
An introduction to coral reefs by NOAA
In this video, Dr. Stephen Palumbi presents his research regarding the coral reefs of America Samoa
The video above, from UCLA's Life Sciences Lecture Series is a bit lengthy. If you are interested in the topic, but don't necessarily want to invest 40 minutes of your attention span, check out these videos by Dr. Palumbi and his colleagues, which are 2-4 minutes in length and focus on ecological sustainability.
Monday, August 1, 2011
Shark Week Ocean Reading
In honor of Discovery Channel's Shark Week, the CRE Blog is featuring ocean-related content this week.
The Wave by Susan Casey - The Wave examines the largest and most extreme waves of our oceans. Throughout the book, Casey documents two groups who chase these waves around the world; the scientists who wish to learn the secrets of our planet and those surfers who wish to push themselves to the limit physically and spiritually by riding freakishly large waves. This book features discussion of climate in terms of whether or not a consequence of global warming will be more stormy oceans, and thus, larger waves. Click here to read a review from the New York Times.
Casey is also the author of The Devil's Teeth, which focuses on Northern California's Great White Sharks. Click here for the New York Times review.
While Casey's writing features a journalistic tone, The Power of the Sea by Bruce Parker- former Chief Scientist of the National Ocean Service in NOAA- features a voice that is more scientific in nature. Parker discusses particular extreme events like the 2004 tsunami in the Indian Ocean and successfully conveys the history of the human mission to predict ocean related phenomena (for example, tides, tsunamis and storm surges). In addition, he details our contemporary technology that is in use and working toward this end of improving our ability to predict the Sea. The last chapter, entitled Predicting the Future-and Saving Lives is a forward looking discussion driven by the topics of El Niño and long term climate change.
 |
| Author Susan Casey is Editor-In-Chief of O, The Oprah Magazine |
Casey is also the author of The Devil's Teeth, which focuses on Northern California's Great White Sharks. Click here for the New York Times review.
 |
| Author Dr. Bruce Parker, currently of the Center for Maritime Systems at the Stevens Institute of Technology, is the former Chief Scientist of the National Ocean Service. |
While Casey's writing features a journalistic tone, The Power of the Sea by Bruce Parker- former Chief Scientist of the National Ocean Service in NOAA- features a voice that is more scientific in nature. Parker discusses particular extreme events like the 2004 tsunami in the Indian Ocean and successfully conveys the history of the human mission to predict ocean related phenomena (for example, tides, tsunamis and storm surges). In addition, he details our contemporary technology that is in use and working toward this end of improving our ability to predict the Sea. The last chapter, entitled Predicting the Future-and Saving Lives is a forward looking discussion driven by the topics of El Niño and long term climate change.
Subscribe to:
Posts (Atom)